The Analytics module provides customizable dashboards and charts for monitoring your hiring pipeline, workforce metrics, and operational KPIs in real time.Documentation Index
Fetch the complete documentation index at: https://docs.firstwork.com/llms.txt
Use this file to discover all available pages before exploring further.

Dashboards
A dashboard is a collection of widgets arranged to visualize your key metrics:| Feature | Description |
|---|---|
| Custom Layout | Drag-and-drop widget arrangement |
| Multiple Dashboards | Create dashboards for different teams and purposes |
| Sharing | Share dashboards across your organization |
| Auto-Refresh | Real-time data updates |
| Default Dashboard | System-generated dashboard with key metrics |
Chart Types
| Chart Type | Use Case |
|---|---|
| Bar Chart | Compare values across categories (applications per stage) |
| Line Chart | Track trends over time (applications per week) |
| Pie Chart | Show distribution (application sources) |
| Number/KPI | Single metric display (total applications today) |
| Table | Detailed data view (candidate list) |
| CSV Chart | Charts from imported CSV data |
Widget Groups
Widget groups organize related widgets:- Group by hiring flow, stage, or department
- Collapsible sections for organized dashboards
- Shared filters across grouped widgets
Stage Groups
Stage groups enable cross-flow analytics by categorizing stages across multiple hiring flows:- Total candidates in “Screening” across all flows
- Average time in “Interview” stages
- Drop-off rates at “Background Check” stages
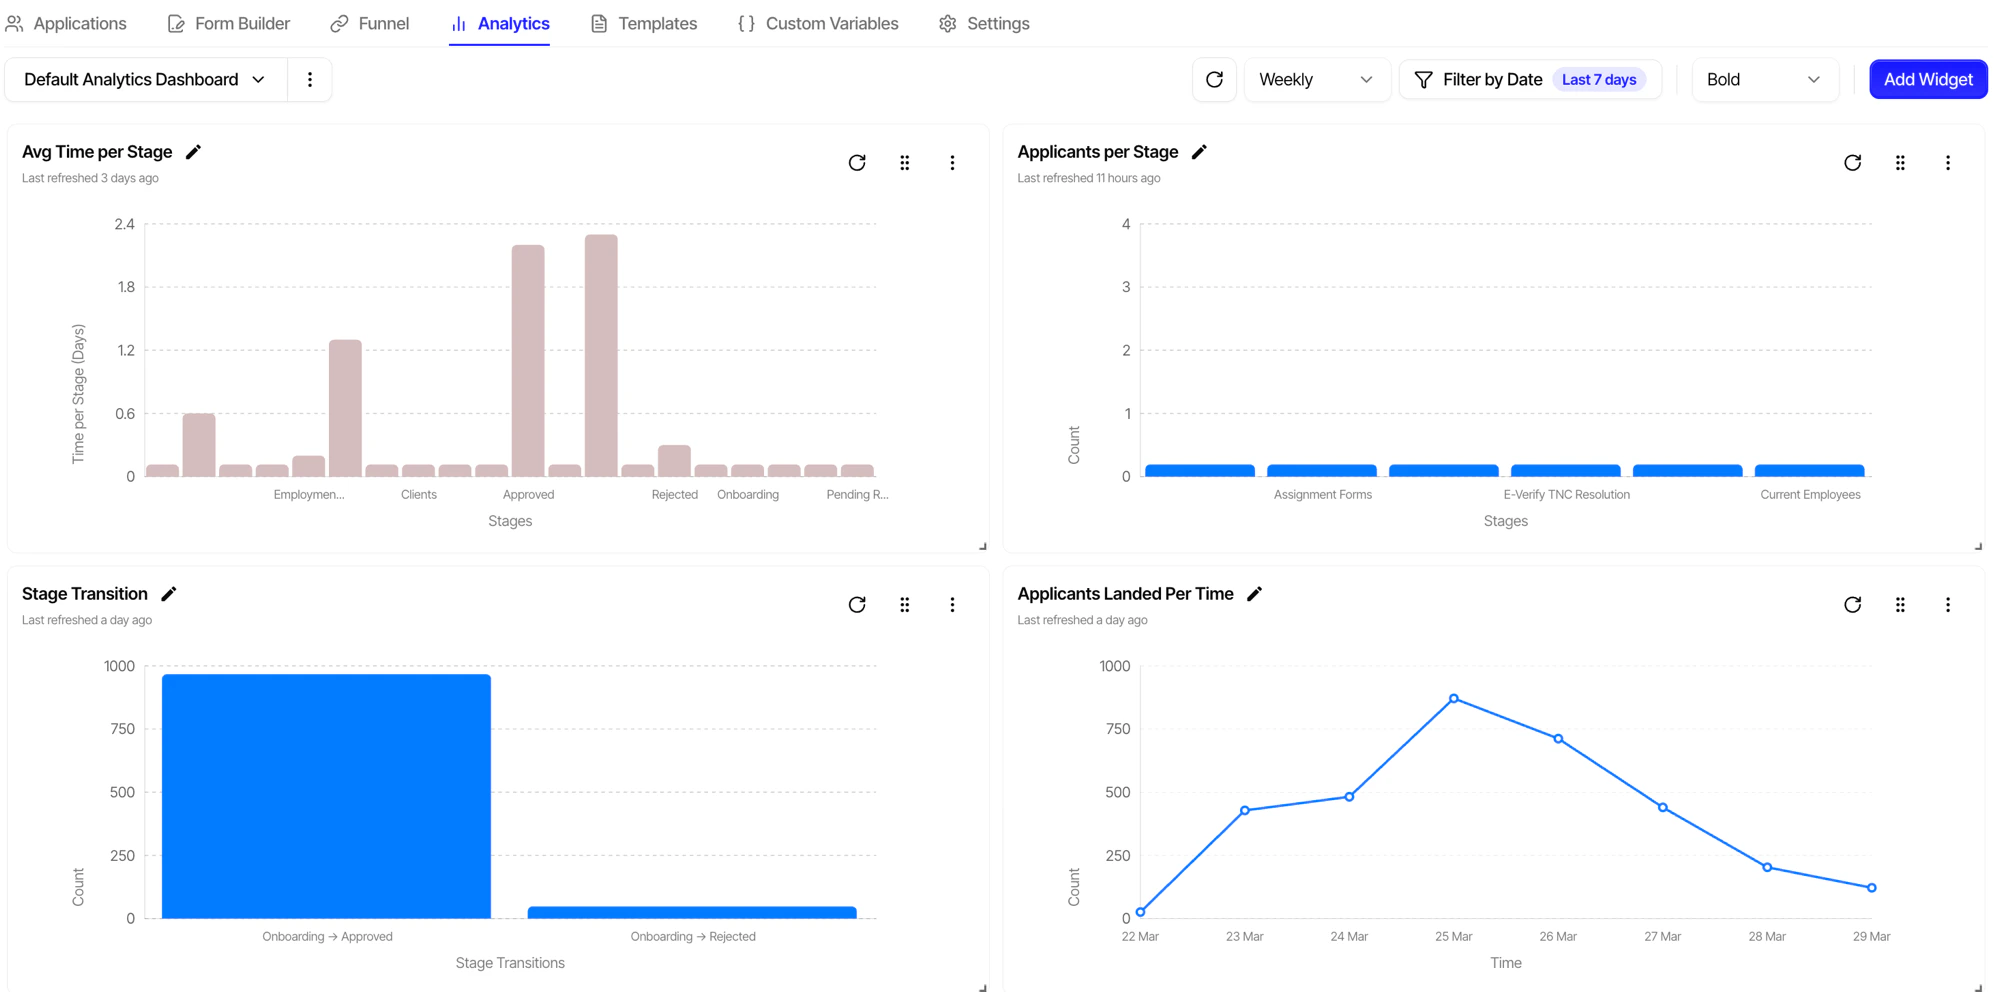
Default Dashboard
Firstwork automatically generates a default dashboard with essential metrics:Pipeline Overview
Candidate count per stage across active hiring flows.
Application Trends
Weekly/monthly application volume with trend indicators.
Conversion Funnel
Stage-to-stage conversion rates for each hiring flow.
Active Workforce
Current contract count by status and entity.